/LONDON, July 25, 2025, 10:30 BST, IRENA, RENEWABLE MARKET WATCH™/ Total installed costs for renewable energy decreased by over 10% for all technologies between 2023 and 2024, except for solar (very small increase), offshore wind, which remained stable, and bioenergy, where costs increased by 16%.
The combination of capacity factors, market share, and financing costs resulted in a slight increase in the levelized cost of electricity (LCOE) for specific technologies. Specifically, the costs rose by 0.6% for solar PV, 3% for onshore wind, 4% for offshore wind, and 13% for bioenergy. In contrast, costs decreased for concentrated solar power (CSP) by 46%, geothermal energy by 16%, and hydropower by 2%.

Chart 1: Cost of Electricity Reduction 2024 vs 2023; Source: IRENA
In 2024, global renewable power capacity additions reached an unprecedented 582 gigawatts (GW), reflecting a 19.8% increase compared to the additions in 2023. This marked the highest annual growth since records began in 2000. Solar photovoltaics (PV) led the surge, accounting for 452.1 GW (77.8%) of the total, followed by wind energy, which contributed 114.3 GW. By the end of the year, these additions brought the total global installed renewable capacity to 4,443 GW. 
Chart 2: LCOE of Renewable Power 2010 – 2024; Source: IRENA
Renewable energy sources are consistently demonstrating that they are the most cost-effective option for new electricity generation. Based on the levelized cost of electricity (LCOE), 91% of newly commissioned utility-scale renewable capacity provided power at a lower cost than the least expensive fossil fuel alternatives. In 2024, renewables contributed to avoiding USD 467 billion in fossil fuel costs, further highlighting their importance in enhancing energy security, economic resilience, and long-term affordability.
Major facts about the renewable power generations costs in 2024 are highlighted below:
• In 2024, new utility-scale onshore wind projects remained the cheapest source of renewable electricity, with a global weighted average LCOE of USD 0.034/per kilowatt hour (kWh), followed by new solar photovoltaic (PV) (USD 0.043/kWh) and new hydropower (USD 0.057/kWh).
• Between 2010 and 2024, total installed costs (TIC) declined sharply across major renewable technologies. By 2024, TIC fell to USD 691/kW for solar PV, USD 1 041/kW for onshore wind, and USD 2 852/kW for offshore wind.
• LCOE increased slightly for some technologies over 2023: solar PV by 0.6%, onshore wind by 3%, offshore wind by 4%, and bioenergy by 13%. Meanwhile, costs declined for CSP (-46%), geothermal (-16%), and hydropower (-2%).
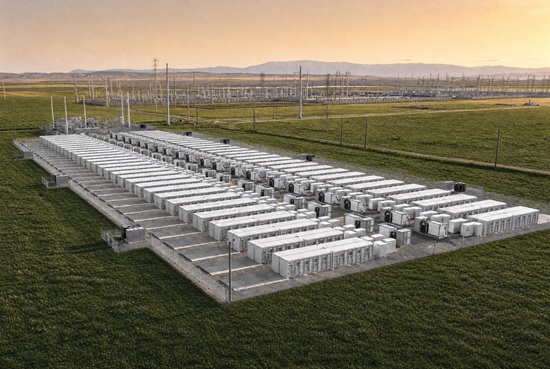
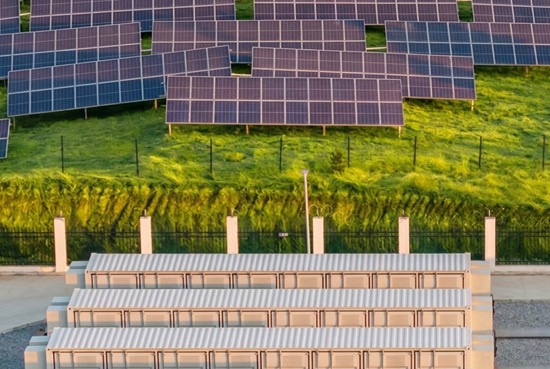
• Battery storage costs declined by 93% from 2010 to 2024, falling from USD 2 571/kWh to USD 192/kWh.
• For onshore wind, China (USD 0.029/kWh) and Brazil (USD 0.030/kWh) recorded LCOEs below the global average, reflecting the maturity of these top markets. For solar PV, China and India reported below-average LCOEs, at USD 0.033/kWh and USD 0.038/kWh, respectively. For offshore wind, Asia’s average (USD 0.078/kWh) was slightly below Europe’s (USD 0.080/kWh).
• Over the next five years, global total installed costs are expected to reach approximately USD 388/kW for solar PV, USD 861/kW for onshore wind, and USD 2 316/kW for offshore wind.
• While long-term cost reductions are expected from continued technological learning and supply chain maturity, emerging geopolitical risks – notably trade tariffs on renewable components and materials and Chinese manufacturing sector dynamics – could raise costs in the short term.
• Financing costs remain a key determinant of renewable project viability, with capital costs shaped by factors such as revenue certainty, capital structure and macroeconomic conditions.
• Integrating more variable renewables into the grid may lead to higher short-term costs; but a growing number of projects are combining solar, wind, storage, and digitalisation – enhancing economic performance and facilitating integration.
• In 2024, renewables helped avoid USD 467 billion in fossil fuel costs, reinforcing their role not only as the lowest-cost source of new power but also as a key driver of energy security, economic stability, and resilience in a volatile global energy landscape.

Chart 3: Gross Energy Storage Capacity Additions and Total Project Cost 2014 – 2024; Source: IRENA
The growth in renewable power capacity additions reflects the accelerating global momentum to increase the share of renewables in electricity generation. As renewable energy capacity is anticipated to grow in the coming years to meet climate goals, enabling technologies such as battery storage, digitalization, and hybrid systems are becoming increasingly important. These technologies help integrate variable renewable energy, enhance asset performance, and improve grid responsiveness. However, challenges continue to exist, including access to financing, permitting delays, supply chain bottlenecks, and geopolitical risks. To accelerate the energy transition, it is crucial to align policies, regulations, and investments more effectively.
For more information and answers to your questions about the renewable power generation costs and related content, you may read here: Global Renewable Energy Market Outlook and Europe Renewable Power Market Reports 2025 ÷ 2034
For a better understanding of the benefits of using our reports, you may read here: Benefit List – Reports of Renewable Market Watch – 2025
About Renewable Market Watch™
Renewable Market Watch™ is delivering strategic insight into emerging renewable energy markets through its experienced research team and cutting-edge predictive analytics data platform. We partner with our customers to provide research, data and consulting reports in areas appropriate to their specific requirements. Our primary focus is emerging renewable energy markets in Asia Countries, Western Europe, South Europe, Balkan countries, Central and Eastern Europe, CIS states (the former Soviet Union), LATAM countries, and MENA countries. For more information about Renewable Market Watch™, please visit: